Generating tracking data
using extremely simple, sometimes downright disgusting techniques....need to learn deep learning to progress....but shouldn't be stopping you from having fun !!!

This is a simple tutorial to make some “tracking data” gifs like this, from youtube videos or any other video source you may find :
The source for this gif is the following url :
I have cut a small part of the video towards the end to make the gif. Alright, let’s dive in !!
Firstly, you need to be able to extract and put together frames at will. The following snippet extracts frames : suitably rename the folder and files

You can extract all frames from the original video, select manually the ones you want to use, and create a smaller video like the following :

Next comes the tracking business, and this is where things get ugly. Anyway, the first thing to make your life a bit easy is to use something that can automatically track objects. Python OpenCV’s csrt tracker does just that. The following images show how to :


In the first image, k is the number of objects to track. It’s set to 11 here, for 11 players. You can set it to anything you like for whichever objects you want to track. You can even do it one at a time. I usually start by tracking the 4 corners of the 6-yard box first, then the in-possession players, then the out of possession players. I also name the in-possession guys “home team” and out of possession folks “away”. When you execute the first image code snippet, the still image of the first frame of the video appears. Draw bounding boxes on all objects you want to track - click and drag to draw a rectangle just covering the player. Remember to press enter after each bounding box. Do it ‘k’ times - here 11.
After you execute the code in the second image, the csrt tracker will automatically track the objects. Ignore the error; it misses the last frame, but it still does the work. It looks like this :
Here I am tracking the four corners of the box. If there is a mistake in drawing in drawing a rectangle, just redraw (as long as you have not pressed enter). Green boxes will appear when the tracking starts. Keep an eye on it to make sure the boxes track the right thing. Also, when tracking the corner points, you want to track the center of the box, not their bases….so change the line of code :
coordlist.append((x+w/2,y+h))
to
coordlist.append((x+w/2,y+h/2))
Repeat this for all players, save in different csvs and boom !!!

That’s bulk of the work done. Also, combine all the csvs into a single one like this :

Now, next comes the part of putting the animation together. Before that, a word - why did we track the 4 corner points ? It’s because we need to apply a perspective transformation to correct for the angle. A single camera view will not allow perspective transform to correct heights, but their x-y coordinates on pitch can be corrected.
Start by basic imports, also specify the pitch coordinates of the 4 box corner points tracked in order - top left, top right, bottom right, and bottom left. I use Statsbomb coordinates, hence the values here are : (120,30),(120,50),(114,50) and (114,30)

Then, use these points to define the perspective transform and change everything to Statsbomb-like pitch coordinates.

Then, apply some smoothing, because the tracking is very jerky (if you notice carefully). There are two functions you can use : play around with both of them and different values of the parameter sigma until you get the most satisfactory result. There is no easy way here I am afraid.

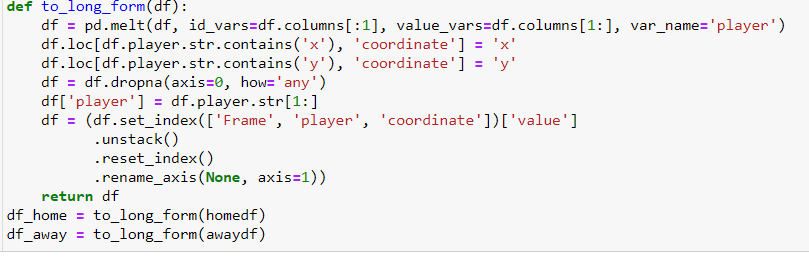
Then, convert to long form, generate animation and save.


Note that we haven’t animated the ball yet; it is because it’s very hard to track such a small and fast-moving object. First make sure the above animation looks clean, correct and not jerky. If not, play around with smoothing until you get it right. Then start tracking the ball. I have to do it manually. I save the home and away player locations, keep a mental note of which player passed to who. Then in Excel directly, I make linear interpolations between those points. Any time there is a ball carry, I just simply assign the carrying player’s location to the ball. Save the ball coordinates as a separate file “ball.csv”, come back to the code, execute the line
balldf = pd.read_csv(folder+"ball.csv")
and then in the sample tracking image just above, uncomment the lines
ball, = ax.plot([], [], ms=6, markerfacecolor='gold', zorder=4, **marker_kwargs)
and
ball.set_data(balldf.iloc[i, 0], balldf.iloc[i, 1])
and rerun it to re-generate the animation with the ball. Finally, you can directly save as a gif or use some website like ezgif to convert the mp4 to a gif. That’s it !!!
Ok….not quite. The way I have described works only if :
(i)the corner points are always visible.
(ii)tracking works in a fail-safe manner.
If condition (i)is not satisfied, then use @lastrowview’s awesome birdspyview streamlit app.
If condition (i) is satisfied, (ii) can still fail. Too fast motion, and the point tracking fails. If players overlap, sometimes the player tracking fails. When this happens, you have to track things manually. Maybe that’s for another post. But the idea remains the same. Use whatever OpenCV resources you can to track points, manually or automatically. Then use perspective transformation, smoothe the paths and animate.
And of course, don’t forget to enjoy !!
P.S. my code snippets look ugly, and this is an extremely naive cumbersome way to do things. But I am still learning, so please don’t judge me yet. Thanks for reading !!!
Hey mate,
Great article! Was having trouble recreating the tracking gif, wondering if I can get some help. Was hoping if you still have the csv or code files (or maybe package versions) on GitHub?
Really nice, Soumyajit! 🙌